Target expression patterns provide valuable insight in target validation, understanding biology, and the molecular basis for compound effect. Expression studies can be performed at protein level, mRNA level, secretion level, at surface level, and expression by immunofluorescence.
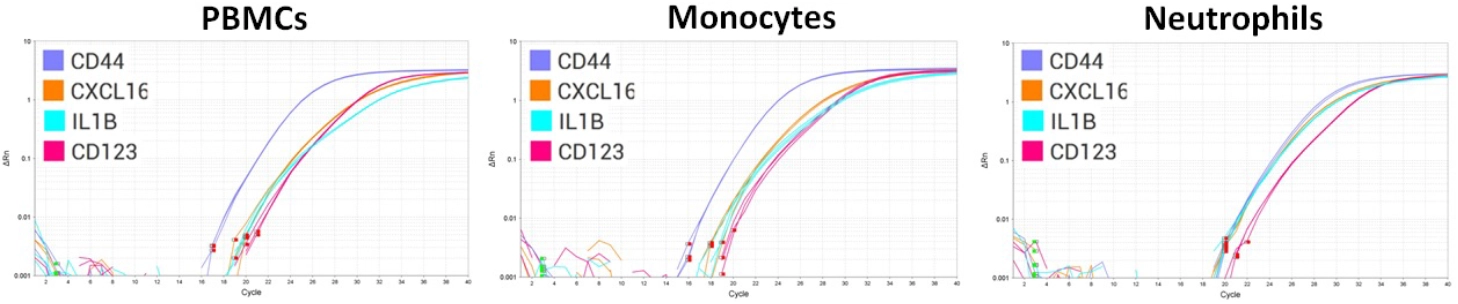
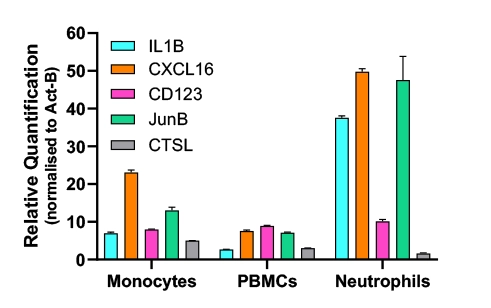
Figure-A: CD44, CXCL16, IL-1b and CD123 mRNA amplification in PMBCs, Monocytes, and Neutrophils and gene expression levels normalised to b-Actin housekeeping gene. Each test condition represents data from triplicate wells.
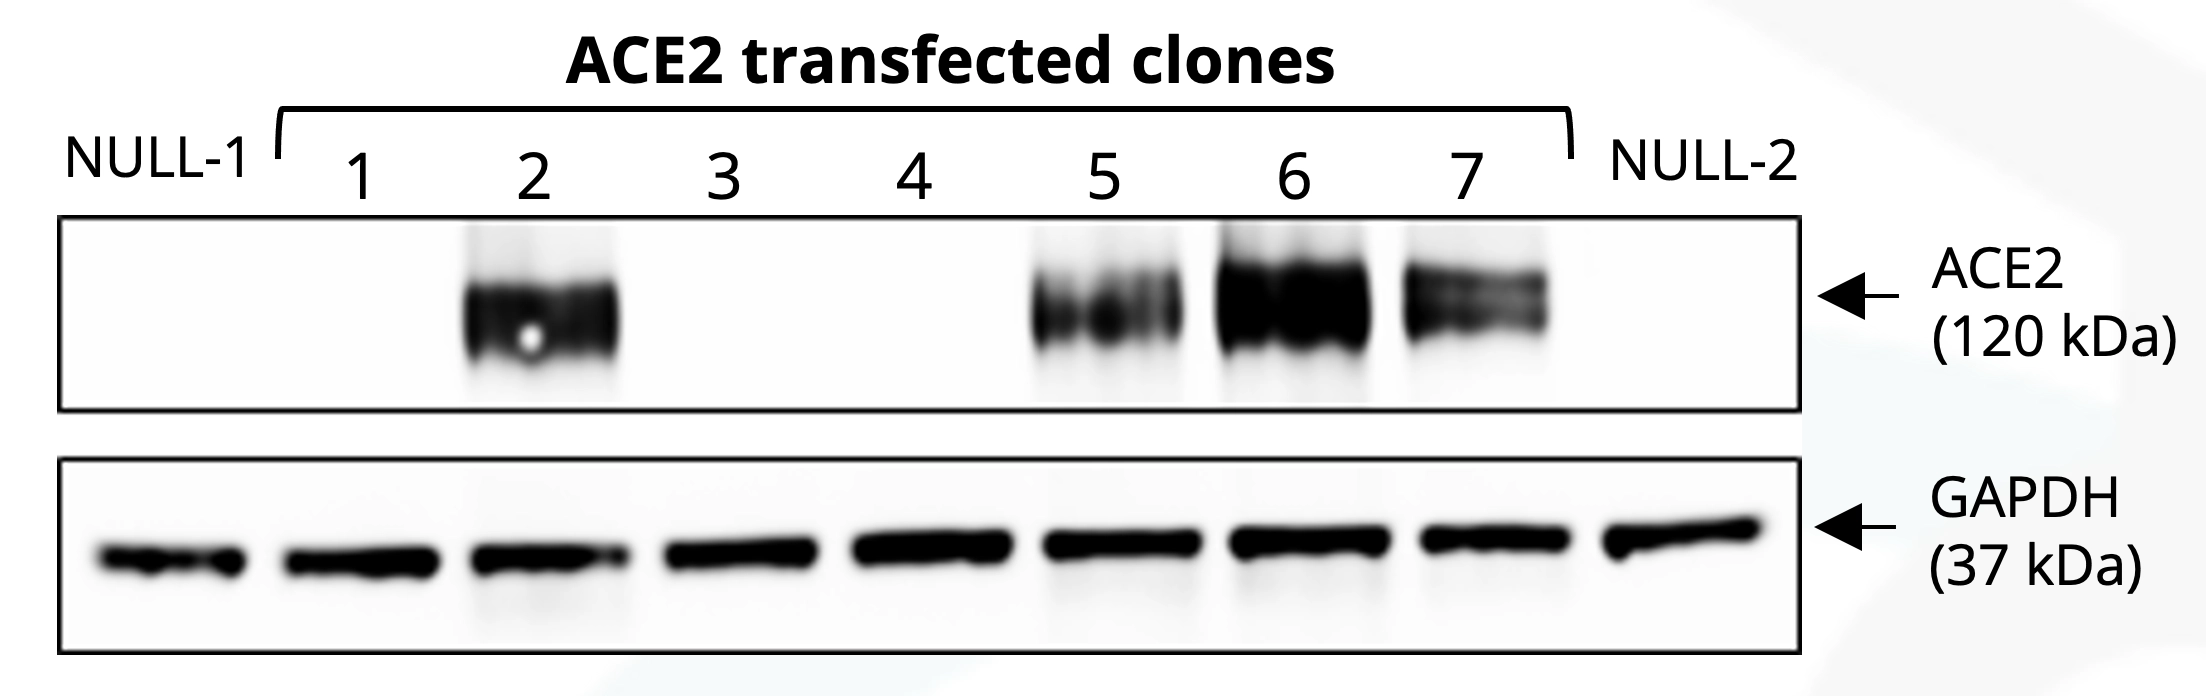
Figure-B: Western blot analysis of HEK-293 cells transfected with ACE2 (stable clones-1 to 7) compared with NULL transfected clones.
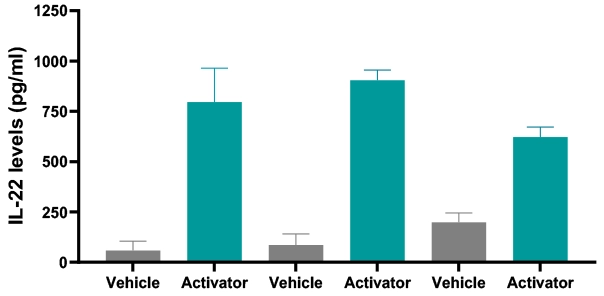
Figure-C: IL-22 levels in T cell supernatant
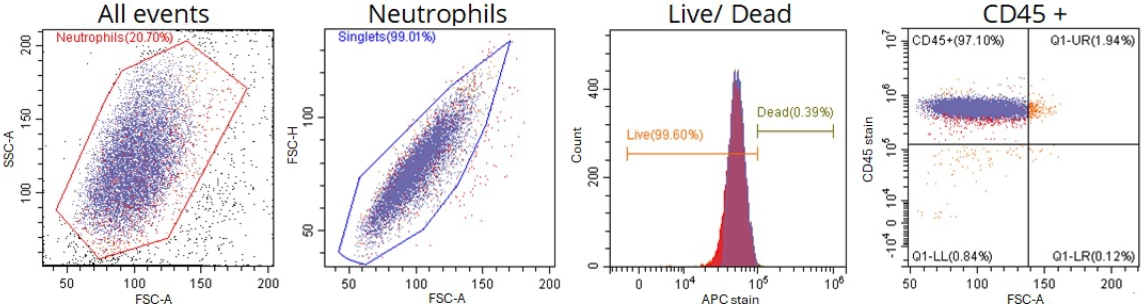
Figure-D: CD45 expression in healthy donor whole blood
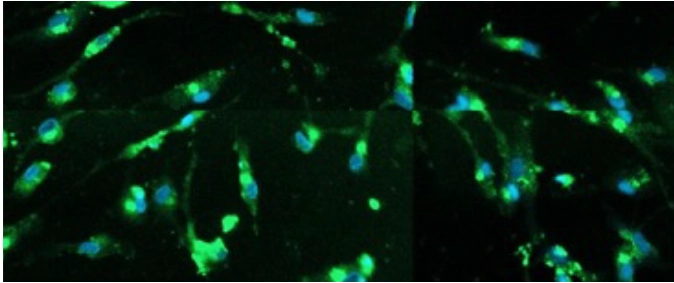
Figure-E: TMEM119 expression (green) in iPSC Microglia. Nuclear marker (Blue)
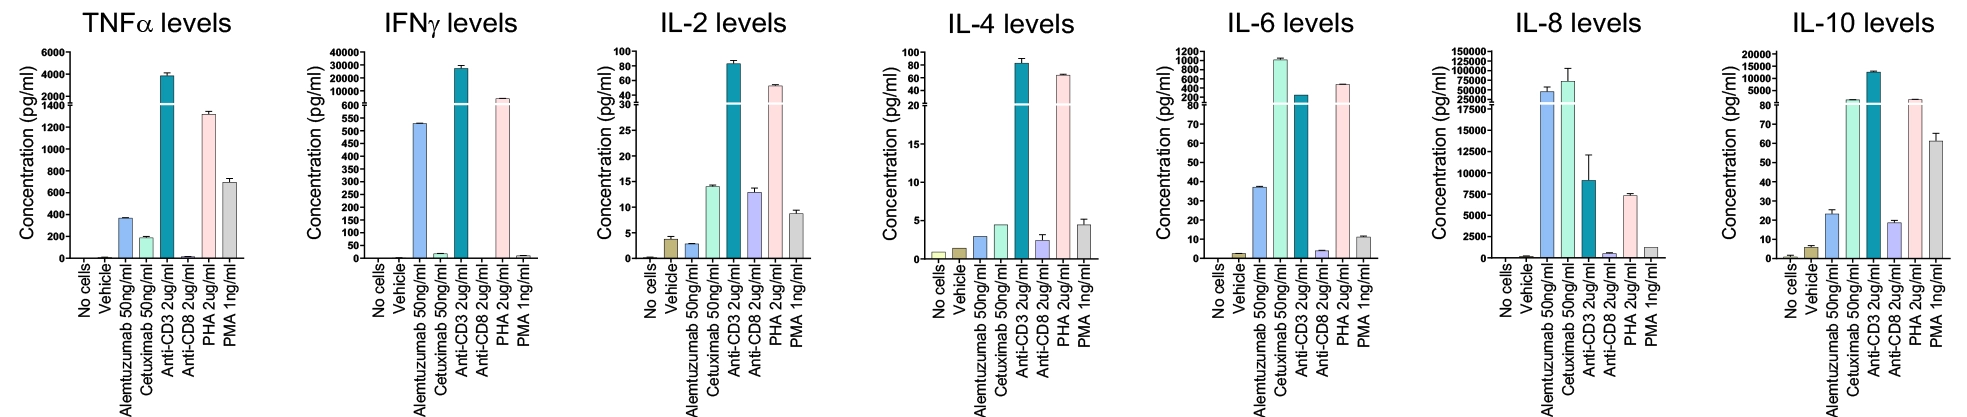
Figure-F: Compound effect on Cytokine release into PMBC supernatant (fresh PBMCs isolated from healthy donor blood)
Here we demonstrate our expertise in measuring target expression levels and BioMedha can support suitable assay formats tailored to client project needs (e.g. target validation, understanding biology, compound efficacy, mechanism of action studies, and siRNA knockdown studies).
© Copyright BioMedha Limited. Company Reg no: 09872164 | VAT reg no: GB 303220569
© Copyright BioMedha Limited
| Cookie | Duration | Description |
|---|---|---|
| cookielawinfo-checkbox-analytics | 11 months | This cookie is set by GDPR Cookie Consent plugin. The cookie is used to store the user consent for the cookies in the category "Analytics". |
| cookielawinfo-checkbox-functional | 11 months | The cookie is set by GDPR cookie consent to record the user consent for the cookies in the category "Functional". |
| cookielawinfo-checkbox-necessary | 11 months | This cookie is set by GDPR Cookie Consent plugin. The cookies is used to store the user consent for the cookies in the category "Necessary". |
| cookielawinfo-checkbox-others | 11 months | This cookie is set by GDPR Cookie Consent plugin. The cookie is used to store the user consent for the cookies in the category "Other. |
| cookielawinfo-checkbox-performance | 11 months | This cookie is set by GDPR Cookie Consent plugin. The cookie is used to store the user consent for the cookies in the category "Performance". |
| viewed_cookie_policy | 11 months | The cookie is set by the GDPR Cookie Consent plugin and is used to store whether or not user has consented to the use of cookies. It does not store any personal data. |